
Those of you who are familiar with the television quiz show Blockbusters will recognise the whimsical quote and of course it’s childish humour for we Brits! The Bob in question was the late Bob Holness. I believe the programme was also produced in the USA, but I don’t think to much success? I will stand corrected if my American friends say “Of course Lee, we know and love the show”.
My cover image is also inspired by the quiz, with letters carving out, weaving from the top to bottom, the word p-value.
Oh that’s the P you are talking about Lee!
In this, my latest ‘Devil is in the Detail post’, I take a look at this tiny little decimal pointed number that ranges between 0 and 1 and which scientific papers often contain, packaged along with an eye catching statement very much like
The treatment effect was statistically significant with a p-value of .048
Note: the value being less than .05, the widely used/ by convention significance level threshold.
P-values also appear all over social media, within press releases, other reports, and are often quoted by advocacy groups. Some very typical examples
This treatment was only rejected because of a slightly non-significant p-value.
We know this drug works and the p-values show it, approve it!
Look at the p-value in this post analysis of this sub-group, significant! This drug works!
P-value is an abbreviation for ‘probability value’, and to paraphrase, is the likelihood of observing a treatment effect of at least this size given that treatment is not effective. In plain English, it is the probability of any effect being by ‘pure chance’ and not by any reason of a treatment being tested.
The sheer over importance of p-values for ALS/MND does, very sadly, underline the absolute marginality of, or generally poor, treatment candidates that currently dominate our disease landscape today. I am sure, that like me, many readers might have often come to the conclusion that statistical significance is almost ‘eked out’ in some trial results and reports that they read.
I am certain that p-values would not attract this same level of attention if we were witnessing dramatic effect treatment trials. We all sincerely hope that this will change for the better and as soon as possible. But, whilst we are still challenged, p-values will persist, remain very important, must be examined carefully and conclusions not jumped to. We can all be absolutely sure, and trust, that our regulators, along with their senior bio-statisticians, will be anything but cursory in understanding the real potential significance of significance value(s) (please pardon the double noun!).
I aim to give you a short list of take aways to have handy on a notepad when you read a paper or statement to help you check the validity, solidity or even the very relevance of a p-value. If you don’t have time to read this full post now, you can simply jump to the take aways and summary. For those of you eagerly crunching that biscuit, with your coffee, please read on.
All of the example statements, aforementioned, containing the phrase p-value, can be problematic, misleading and in some way might be viewed as denigrating or misusing this vitally important number.
I will begin the real meat of this post, just as your favourite rock band or artist does, with an outstanding, loud and dramatic opening!
Most published research findings are false!
John P.A. Ioannidis – 2005
In his now seminal statistics essay, written some 17 years ago and as relevant today, as ever, John P.A. Ioannidis, shows how the outputs of the majority of scientific papers are, to put it simply, false!
Gosh, I wonder why that is?!
I must read his essay. But enough of all that, and back to the subject in-hand, p-values!
Significance testing is indeed an essential process in the researcher’s toolbox. The resultant number is often central in approval applications to our regulators such as the FDA, MHRA and EMA, and serves effectively as a ‘hard line’ for approving, or not. Strictly, however, having a reported statistically significantly p-value does not necessarily mean that a measured effect is either meaningful nor attributable to a treatment. Yes, it’s all in that ‘devil detail’ again!
So is it perfect? Absolutely not, and that is take away no. 1 from this devil detail post.
And hot on its heels, is take away no.2, which is that when p-values are used in isolation to represent an indication of a treatment viability, we might miss the strength, weakness, variability and even the very validity of any potential study’s conclusions.
For example, does a value of p = .0486 indicate that a drug works? No it possibly doesn’t. And does a value of p = .087 mean it always does not. No it possibly doesn’t as well! Confused? Well yes, we all might be!
Take for example the following examples that show the results of analysis of a specific ALSFRS-R points difference observed at the end of three hypothetical trials. Adding the 95% confidence intervals (CIs), adds some more, but only a little, context. Is it a bit clearer? Perhaps. What about example C, with its p = .0486? Is the effect actually clinically significant, despite statistical significance? Note, also, how I have also used a different scale in C. Makes it look more significant, perhaps? But A and B look quite compelling, don’t they? However, the CIs are pretty wide?
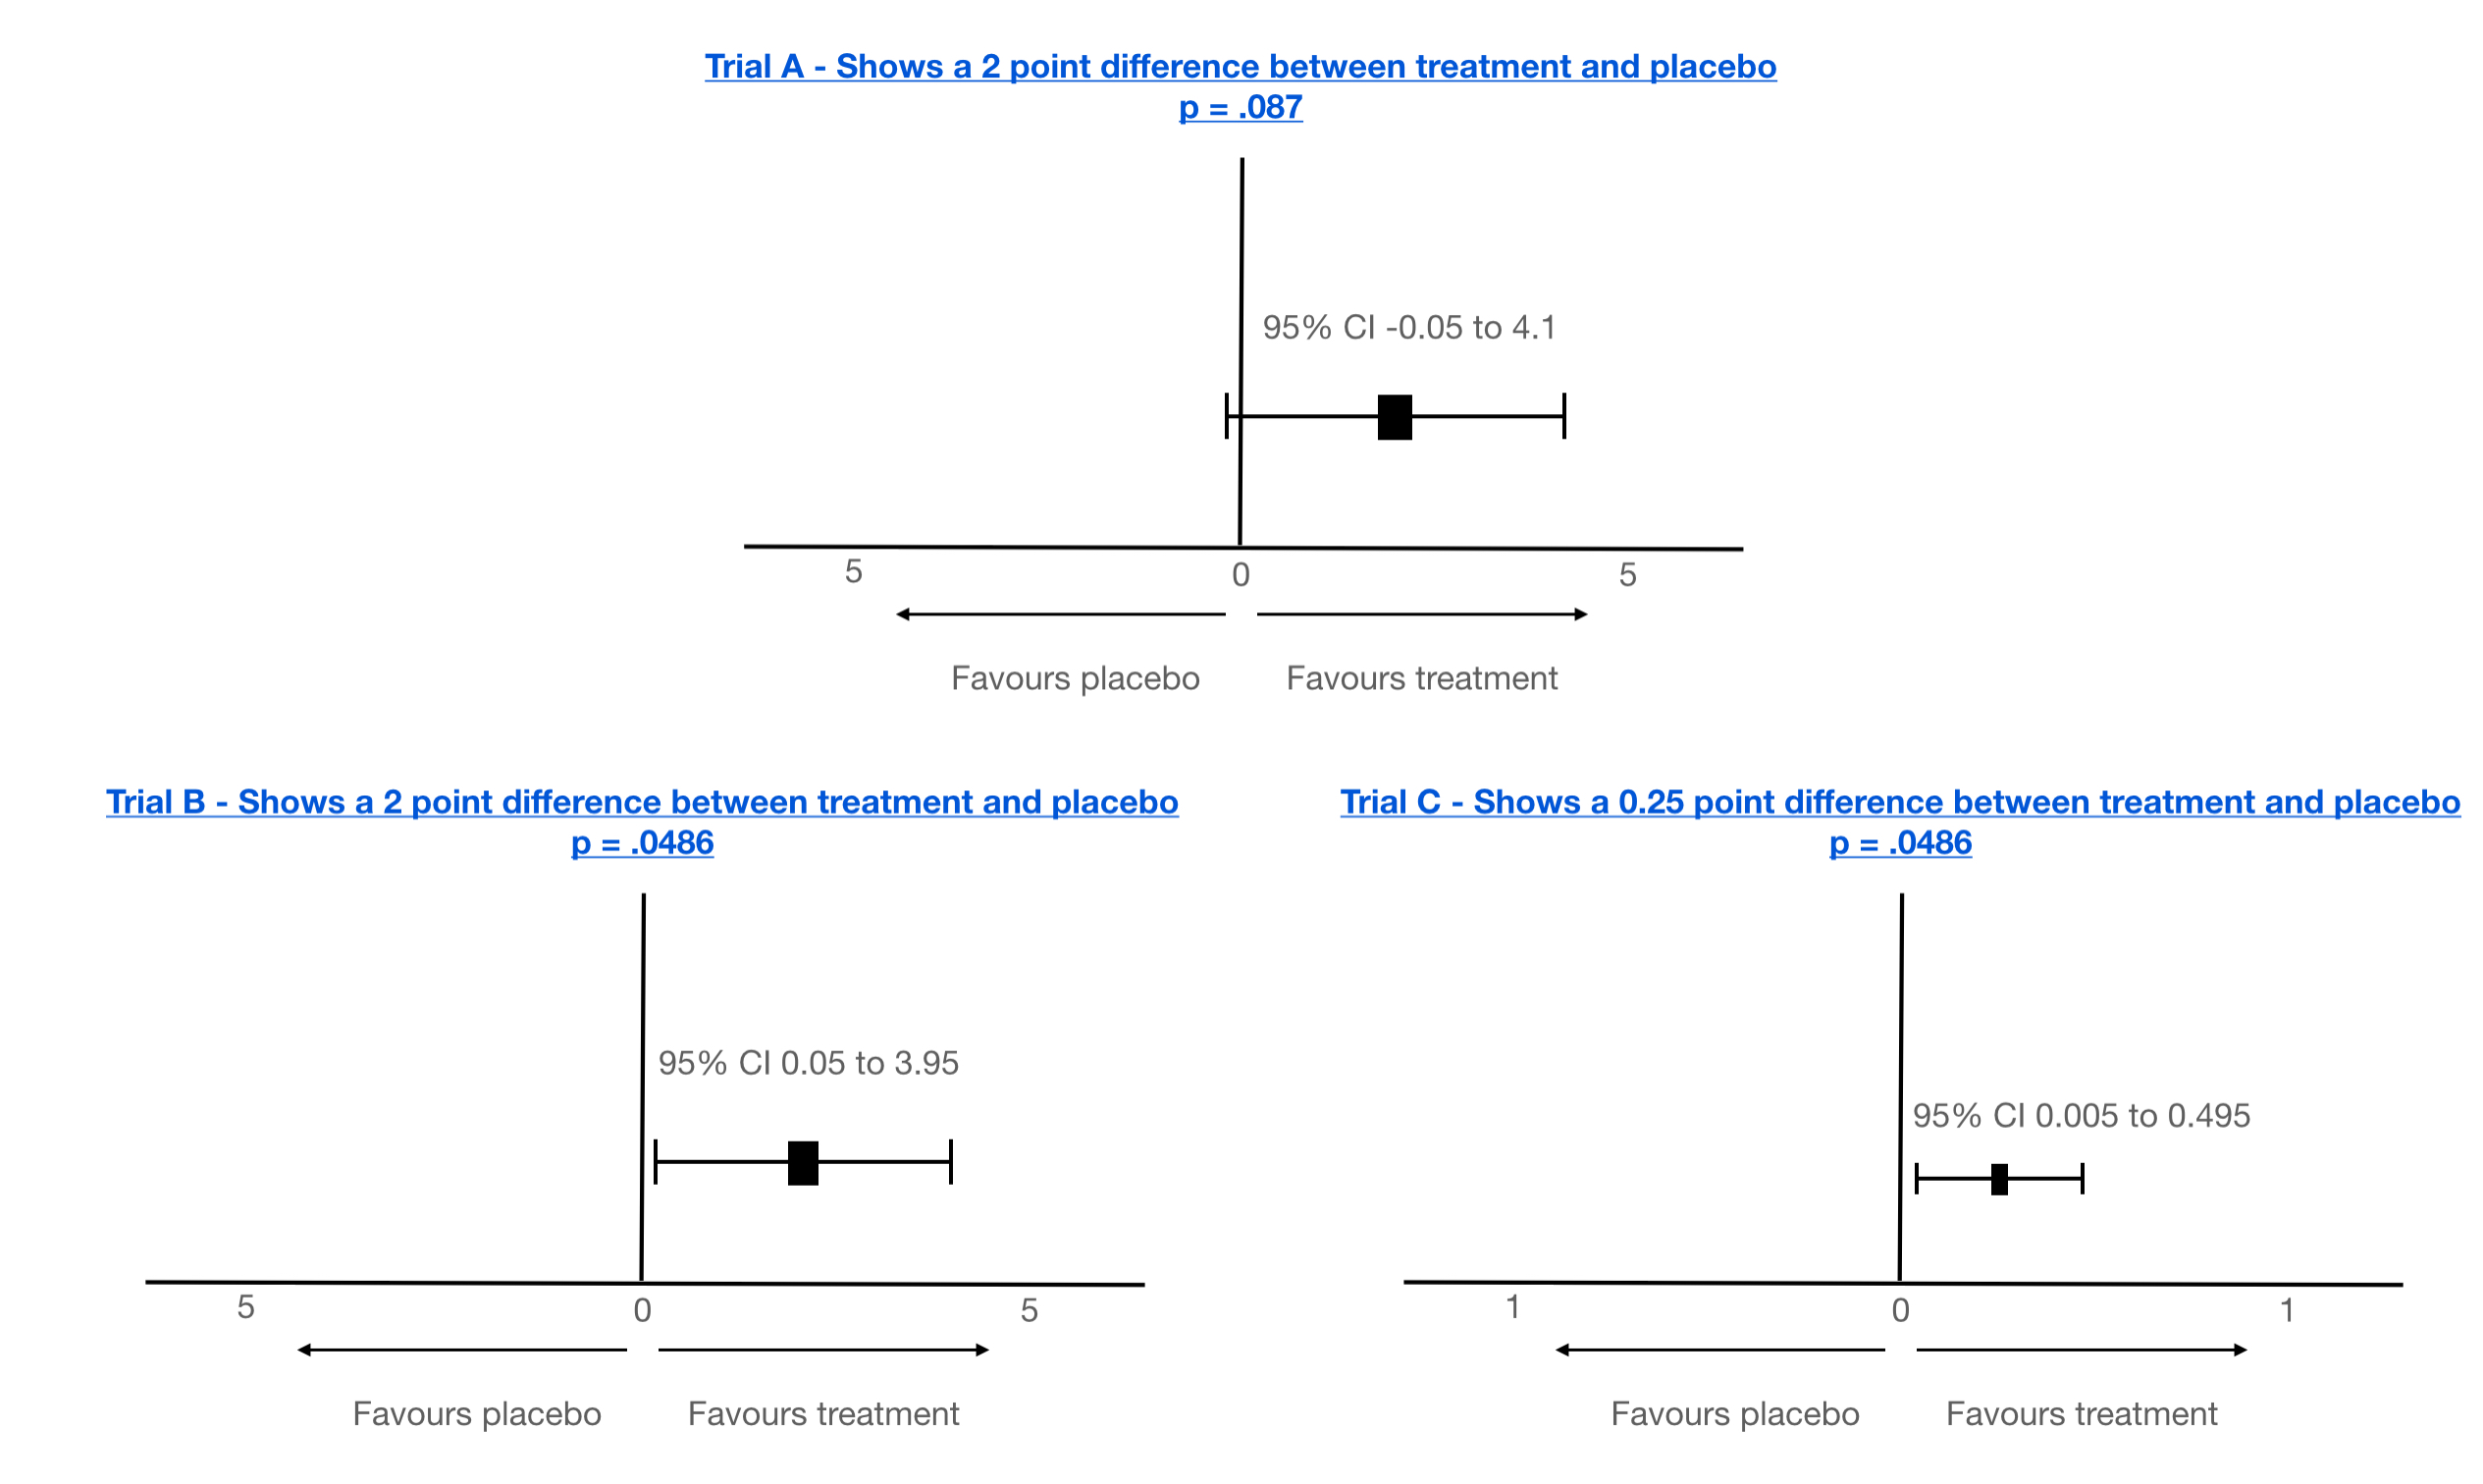
Note: there will always be clear space between 0 and the CI boundaries if a p-value is ‘statistically’ significant. But that’s still not the full story!
Let’s dig deeper…
By convention, a 95% significance level is used in the research community (and in my examples above), equating to a value of p <= .05, being considered significant. And that is take away no.3. This level is actually not that significant!
Why?
P = .05 equates to – within the data under analysis there is a 5% chance that we would observe such an effect or greater, even if treatment didn’t work at all! A 5% chance is 1 in 20!
5% is not a small number! To really appreciate just how big it can be in a real world analysis, I will take a look at the technique of post-hoc analysis.
Post-hoc analysis and false significant p-value identification.
Post-hoc analysis is the process of taking the raw data from a trial and effectively mining it, or less politely ‘torturing’, for areas of ‘interest’. Often 100s, if not 1000s, of statistical tests may be made, scouring for patterns for hints of efficacy. Today this is often achieved using so called ‘Artificial Intelligence (AI)*’, which can give an air of intelligent, almost mystical insight. However, just by pure chance many false statistical associations (statistical association does not equal a causal association), can and will be found.
*The very buzzword AI implies some form of human intelligence, or even validated conclusions. This is a falsity itself. Current computing technology labelled as AI is limited to speeding up analysis and critically AI cannot validate any new biological/chemical hypothesis generated. Not even humans can do this, without experimentation. Artificial intelligence can, however, identify, very rapidly, areas of interest. And it does, producing testable hypotheses quicker than human brute force.
For this reason, post-hoc analysis is not accepted for proposing efficacy in a subgroup. Wise researchers do, however, use post-hoc analysis to postulate new hypotheses for further experimentation.
It’s best to give an example to illustrate the challenges of post-hoc analysis.
Imagine a trial protocol that was designed to test a new wonder drug, A, for MND/ALS with over 200 people. Imagine further, that it failed to show any significance in its primary clinical outcomes. However, on examination, a subgroup was revealed with a particular gene X, mutation Z that was statistically significant showing disease slowdown, and it was published, with that little ‘dang’ thing, the p-value! However, what we might not be aware of, that this was only found during a mining exercise of the trial data across perhaps 2500 gene/mutation combinations and this one specific mutation, Z, indeed, showed statistical significance. Further, it was only in 25 patients, 16 of which were placebo. The sheer number of tests carried out (point of note: a single p-value is the result of a single statistical test), which might not be declared in publications, means that we can expect, randomly, about 125 will turn up as significant at the p <= .05 level even if the drug is not working at all! In fact, where are the other 124!? Even if only 20 tests are carried out, 1 could be expected by chance!
Take away no.4 – is a p-value associated with post-hoc analysis? If so, it cannot be relied on, especially if the size of the group is not powered or confounder balanced (see upcoming sections on power and confounders).
It could be a real effect, but there is not enough evidence and more data and new hypothesis testing is needed to prove/disprove.
Note: there are mathematical methods to adjust p-values from many post-hoc analysis tests to take account for this phenomenon, but I have seen results from many post-hoc analyses not adjusted! That is a big red flag guys! One to keep an eye out for. Here’s some tech detail on how to adjust.
This is why you will see scientists commenting that extra trials are needed, which to many can seem counter-intuitive and perhaps even ‘inhumane’.
Hold on a moment! I did dive straight into the complications of p-values within post-hoc analysis! Let me return to a single p-value being expressed in either a primary objective, post-hoc analysis or any other test. In my three examples with the confidence intervals we still just have the p-value and CIs. Nothing else. There’s more, Lee? Oh yes there is.
Just how can a single test p-value be problematic and perhaps might not mean what it implies?
There are 3 vital underlying foundational principles, or precariously balanced key stones, for creating a stable environment to generate a meaningful and relevant p-value.
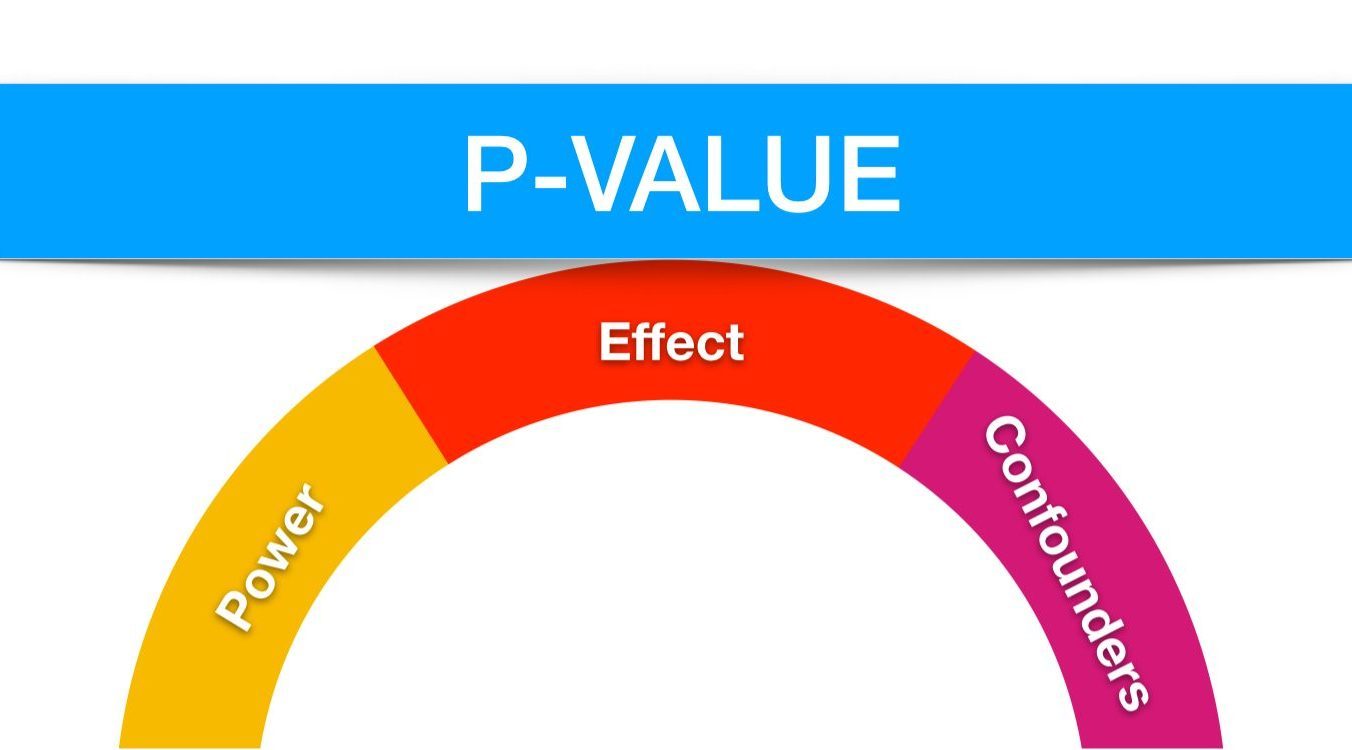
Effect is the change, or difference, being measured (small to large, clinically insignificant to clinically significant etc).
Whenever we observe a p-value expressed it will be measuring the probability of observing an ‘effect’ of at least this magnitude when the drug is ineffective. For example the difference in ALS/MND progression of at least 2 points over say 6 months of a trial. But it could be 1 point, 0.5 point etc. It could be even the slightest difference in a measure of a chemical, possibly an investigational bio-measure.
This is the subject of much debate, especially in short trials given our current limited disease measures and the almost inevitable minimum time for a treatment to have actual impact.
It’s importance to a p-value? – depending on the size of effect being tested, a trial will require designing/sizing to an appropriate power. But what is power?
Power – Technically, power is defined as equal to 1 minus the probability of a type-2 error and is effectively controlled by the number of patients within any one analysis/sub-group/pre-specified subgroup (small to large, unrepresentative to representative etc). This is particularly important to reduce the chance of a type-2 error. But what exactly is this type 2 error, and what about a type 1 error come to that?!
False positives and False negatives – Type 1 & Type 2 errors
A bad outcome for any clinical trial is the production of false positives or negatives, ie ambiguity.
With a sufficiently large sized trial almost any mathematical difference (whether clinically significant or not) can be shown as statistically significant (this is a false positive – a type 1 error example). A false positive can also happen in a small trial, over a short time with an effect being detected that is also statistically significant that misrepresents the true effect, or even finds an effect that is NOT there. This rather interesting scenario is known as the ‘winners curse’. It only takes one or 2 patients in a small trial from a small group of say 20 to completely skew a result, and amplify an effect that is just patient variability. False negatives (type 2 errors) are more likely found in small trials where a meaningful effect might not be observed if the clinical change is too small to be detected for the sample size. But it can also happen in large trials if the treatment and placebo arms are not equally representative of the population.
To detect and validate a given effect, there is a minimum number of patients required in the treatment and placebo arms of a trial. Many early stage trials are simply not powered for efficacy. So when such trials report p-values for efficacy, they need to be taken with a huge pinch of salt, unless of course the treatment is a raging success with pervasive and dramatic disease halting/reversal properties. These are often phase 1 trials and, to be wholly fair, are never designed for efficacy, but safety. Many of these trials also do not even have a placebo arm, ie are fully open label. Any such comparisons need to be taken with another pinch (or handful?) of salt and the p-values that do appear in such reports are often quoted out of the actual, and very real, context. Should they even be quoted? I personally don’t believe they should.
All pivotal trials, however, should/must be powered for efficacy detection with enough patients to show a ‘clinically’ meaningful effect for any primary/secondary endpoints, and ideally any pre-specified sub-groups. However, even pre-specified groups often are still in reality only exploratory as the randomisation (including confounders, see following section) is not guaranteed.
So what is a well powered and sized study for detecting efficacy in a pivotal trial (typically a phase 3)?
There are several excellent papers available that detail the calculations necessary to estimate the patient numbers based on the effect size that is to be detected, length of trial, significance level, power, patient variability and fall out rate as the primary factors. For example, Ruben van Eijk’s 2018 paper. I have created a little chart to give a feel for the total number of participants required for a placebo controlled trial (numbers are the total number required, ie combined placebo and treatment) powered at 90% (ie only a 10% chance of missing an effective treatment signal) and detecting a 25% difference in ALSFRS-R progression rate. My thanks go to Ruben van Eijk for confirming the indicative numbers based on his paper.
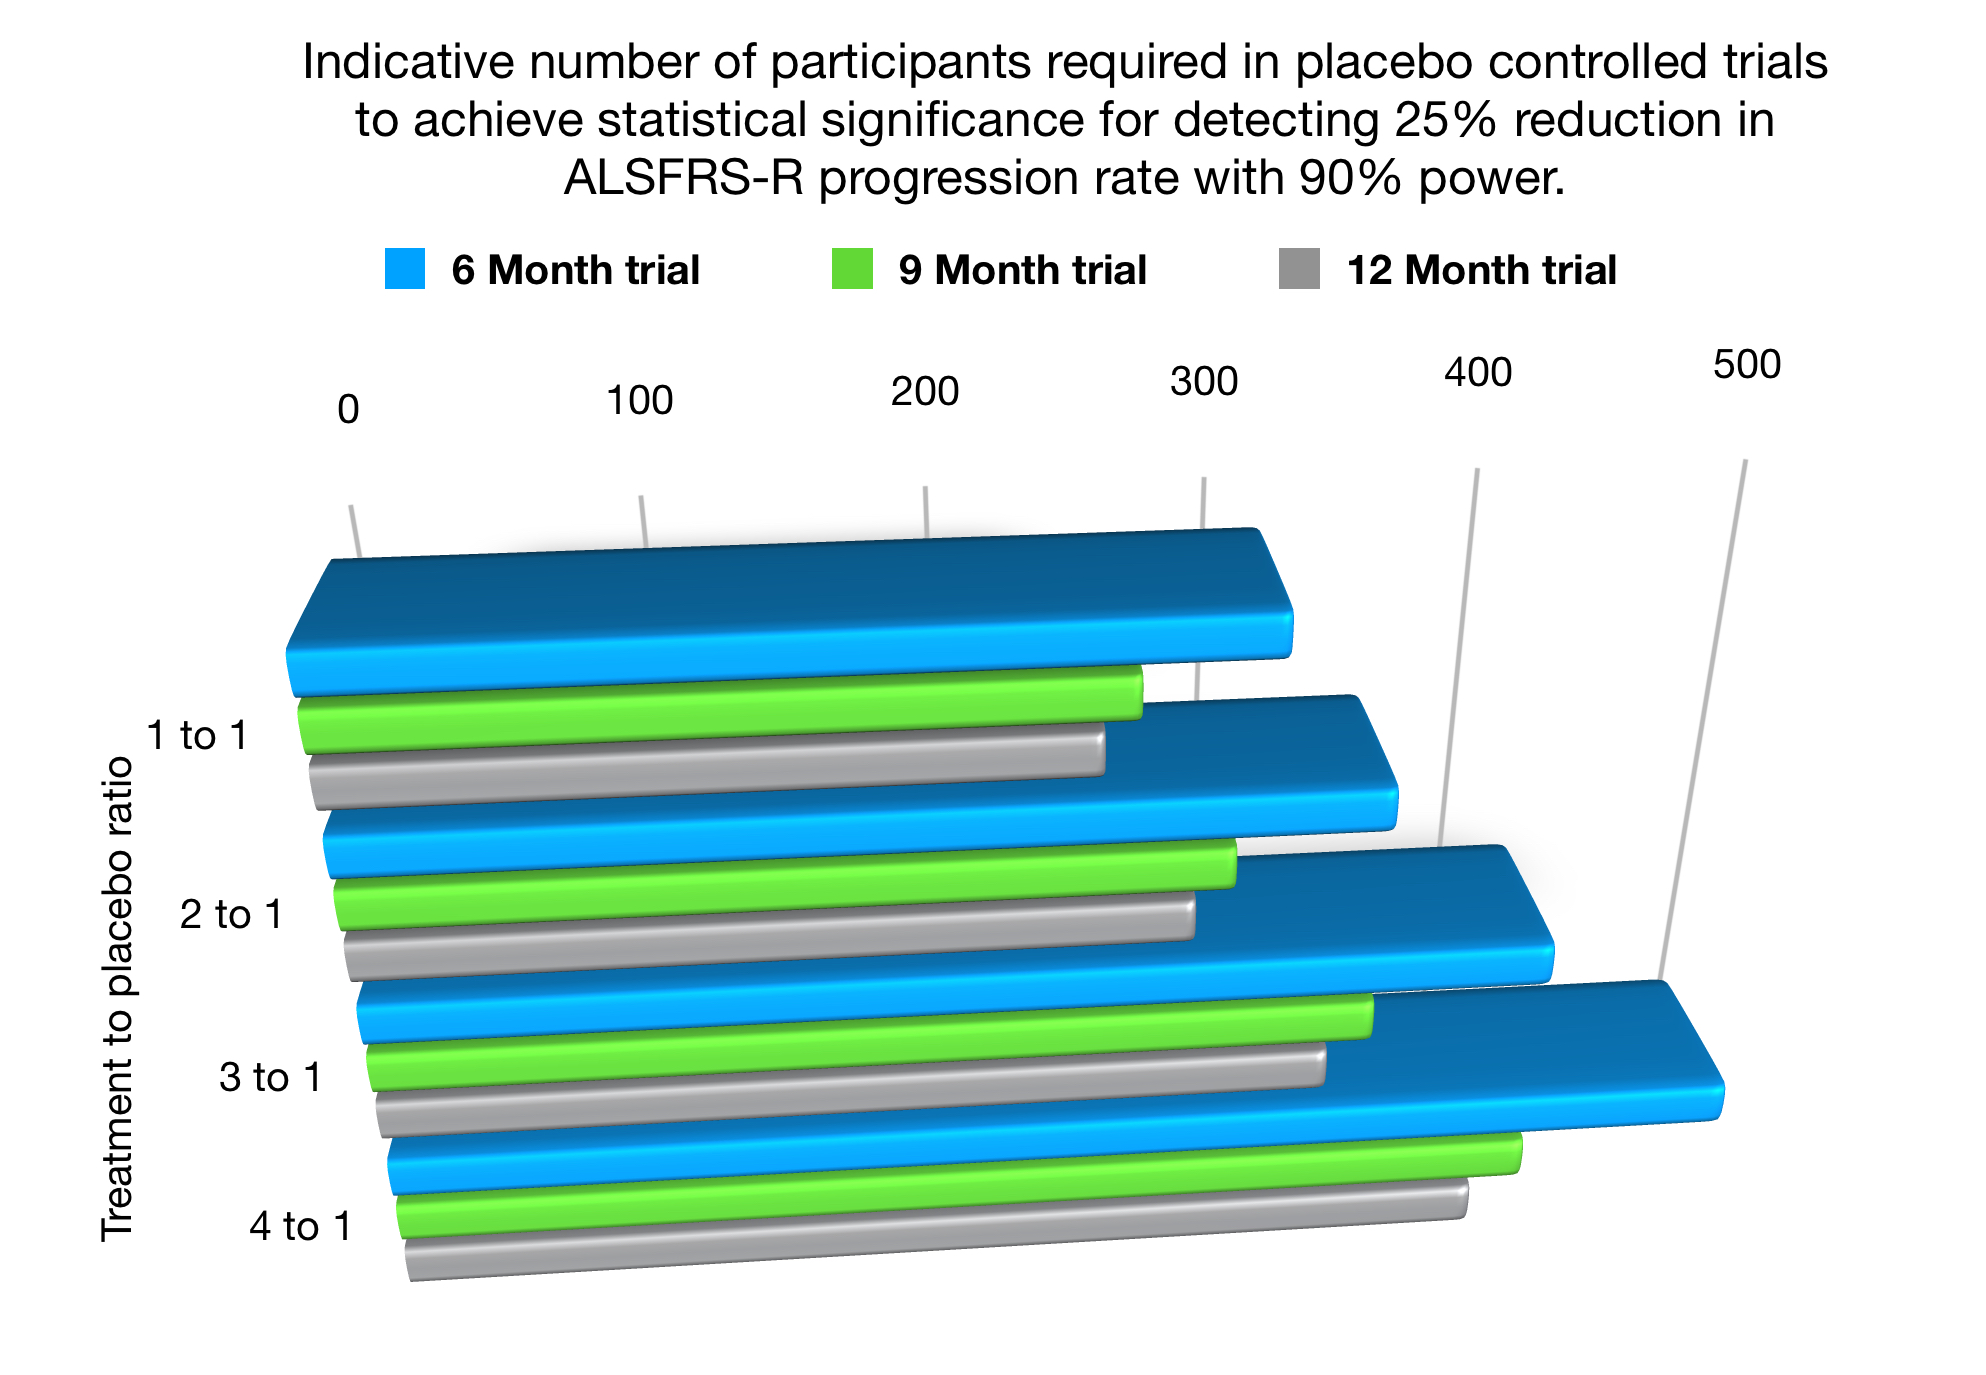
As a small, but fascinating, aside I have also included within the above chart the numbers needed in placebo reduction trials, known as ‘many to 1’ studies. For eg a 3:1 study where 3 patients receive treatment to 1 receiving placebo. Note – the minimum numbers overall required in a trial actually increase. Yes, such trials do mean that although the placebo chance is reduced for any one individual, the trial is actually lengthened (takes longer to enrol and run) and of course the raw financial costs of the trial rise. Although such an aim may be commendable, it can also expose more patients to experimental treatments, which inherently contain risk.
Ultimately, however, sizing a trial is a trade off between how overconfident you want to be that a treatment works and what risk are you willing to take to miss a potentially less effective treatment. A 300-500 sample size is quite reasonable for pivotal phase 3 designed to be as unambiguous as possible,
But readers, I have wandered far, far away from p-values!
Simply put, if a p-value is produced from an ill-defined, perhaps even non-clinically significant effect, and/or the numbers of patients analysed is too small, or non-representative of population, then a p-value could be about as useful as a chocolate teapot! That’s another British saying I think. It’s also, take away no.5!
Confounders – The final key stone. A confounder is any variable that might effect the outcome of a trial independently of any possible treatment effect.
As usual, an example will help illuminate this 3rd key p-value keystone.
Imagine, yet again, that despite the trial example described earlier failing, a subgroup is isolated (using post-hoc analysis), that appears to show, using a p-value, statistical significance, ie a possible effect?
Unless the proportions of confounders are equally spread between the placebo and treatment arms within that newly discovered sub-group, the potential effect could indeed be totally spurious.
Point of note: – It is important to note that even in a well-designed trial only information on a limited numbers of confounders is typically gathered and even despite these observed confounders being balanced, unmeasured confounders could be present.
Here’s how. Within this hypothetical subgroup identified, the treatment arm was found to be comprised entirely of people under 40 years old and the placebo arm all were over 65! Young people have a better prognosis, so what could appear a treatment effect could be simply age differentiated progression rates, especially with such a large age difference. Age is the misleading confounder here.
Other common confounders include, gender, MND sub-type, time from diagnosis, rate of progression, onset region of disease, treated in ALS/MND clinic versus general neuro-clinic, co-medications etc etc. And that’s the final take away No.6 – has a sub-group been randomised for confounders?
That’s all folks for today’s devil detail ramblings. Phew, I hear you utter!
I hope you have found them useful. I know it’s a lot to take in.
But please rest assured that MND/ALS clinicians, globally, look at clinical trial data in a truly holistic manner, going way beyond the headlines and, to be blunt, dramatic sound-bites on social media. They do this for each and every treatment candidate to both assess the viability of the treatment, but most importantly and above all, to determine whether it is something they would want for their own patients.
I will finish off here with the take away summary, with a bonus 7th added!
Take away menu
Starters
1) p-values are not perfect.
2) They must not be considered in isolation, look for confidence intervals at a minimum.
3) p<= .05 is not actually that significant
Main Courses
4) Any p-value from post-hoc analysis cannot be relied on for efficacy proof.
5) If the underlying data is not powered sufficiently or randomised then a p-value is meaningless.
6) Confounding factors must be balanced. Pre-specified and newly identified subgroups are particularly vulnerable to confounder corruption.
Taking all of the above into account, here’s the bonus take away, number 7 is (roll on drums)….
p = .05 is not really that significant as per take away no 3, especially if a marginal effect drug. Should we be looking at level p = .005 (99.5% confidence)? There are a number of good papers available discussing the proposals amongst the scientific community.
We should really!
I must go as I really, really want to read that essay all about most published research findings being false!
My next post subject? It will probably be a short post on ‘data spread’, dispersion or variability and how it is represented in trial reports.
